
How poor is your area - and how much worse will it get?
Credit reference company Experian, besides supplying information to credit cards companies and banks, also provides data for the public sector – and has given us this data.
It ranks every English local authority by a set of key poverty indicators, they include:
• Greatest overall risk of poverty taking account of multiple factors
• Greatest likelihood to contain those in current poverty
• Greatest likelihood to contain those who may fall into poverty in the short to medium term
• Greatest likelihood to contain those who may fall into poverty in the longer term
• Greatest likelihood to contain households whose income is less than 60% of the median for England
• Likelihood for the presence of households at risk of long-term unemployment
• Likelihood for the presence of households at greatest risk of experiencing child poverty
• Greatest likelihood to contain households at risk of financial exclusion
• Greatest likelihood to contain households at risk of chronic obstructive pulmonary disease
Where do they get the facts from? Experian says:
The majority of indices are derived from our proprietary sources and our own modelled work. A key input for most of the indicators is Mosaic Public Sector, a version of Experian's consumer classification but designed specifically for use by Public Sector organisations. Mosaic contains over 400 data variables. Two thirds of the indicators use the linkage between Mosaic Public Sector and external data to derive a baseline to create a specific indicator of poverty. The other third are based upon either Experian proprietary consumer marketing data, or modelling of publically available data such as the Index of Multiple Deprivation, HMRC data on Child Poverty and Claimant Count data from NOMIS (unemployment).
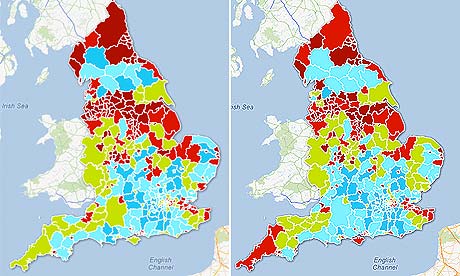
The data shows just how the north-east of England is at the top of these indicators. The key rankings are:
• Most at risk of falling into poverty: Middlesborough
• Most likely to contain people living in poverty: Hull
• Most at risk of long-term unemployment: Newham
• Greatest risk of child poverty: Newham
• S Tyneside is the place most at risk of households with COPD, chronic obstructive pulmonary disease
The other side of this is the most 'resilient' places: City of London, Westminster, Richmond, Hertfordshire and Buckinghamshire.
How does it compare to the places suffering the biggest cuts in public spending?
The full data is below. What can you do with it?
Data summary
|
Local Authority (District/Borough, City, Metropolitan- excludes Counties)
|
Overall risk of poverty
|
In current poverty
|
Income less than 60% of the median for England
|
Risk of long term unemployment
|
Greatest risk of child poverty
|
Risk of financial exclusion
|
|---|---|---|---|---|---|---|
|
SOURCE: EXPERIAN |
||||||
| Middlesbrough | 1 | 2 | 2 | 18 | 14 | 6 |
| Kingston upon Hull | 2 | 1 | 1 | 11 | 18 | 9 |
| Knowsley | 3 | 4 | 7 | 10 | 12 | 5 |
| Hartlepool | 4 | 6 | 9 | 13 | 21 | 13 |
| Liverpool | 5 | 5 | 5 | 12 | 27 | 3 |
| Nottingham | 6 | 3 | 3 | 21 | 16 | 7 |
| Manchester | 7 | 7 | 4 | 17 | 17 | 1 |
| Stoke-on-Trent | 8 | 11 | 14 | 14 | 26 | 8 |
| South Tyneside | 9 | 9 | 12 | 20 | 20 | 4 |
| Blackburn with Darwen | 10 | 10 | 22 | 15 | 31 | 14 |
| Leicester | 11 | 8 | 6 | 35 | 13 | 15 |
| Wolverhampton | 12 | 12 | 11 | 24 | 19 | 11 |
| Halton | 13 | 19 | 23 | 29 | 37 | 19 |
| Sunderland | 14 | 13 | 17 | 22 | 23 | 12 |
| Mansfield | 15 | 15 | 28 | 37 | 43 | 25 |
| Rochdale | 16 | 24 | 51 | 25 | 44 | 21 |
| Newcastle upon Tyne | 17 | 16 | 10 | 47 | 46 | 23 |
| St Helens | 18 | 34 | 46 | 46 | 54 | 33 |
| Birmingham | 19 | 14 | 13 | 49 | 30 | 22 |
| Burnley | 20 | 22 | 54 | 16 | 51 | 18 |
| Redcar and Cleveland | 21 | 27 | 20 | 63 | 65 | 49 |
| North East Lincolnshire | 22 | 18 | 15 | 48 | 74 | 41 |
| Gateshead | 23 | 32 | 40 | 30 | 45 | 10 |
| Stockton-on-Tees | 24 | 36 | 32 | 60 | 61 | 35 |
| Sandwell | 25 | 21 | 19 | 32 | 29 | 16 |
| Salford | 26 | 29 | 44 | 40 | 55 | 20 |
| Oldham | 27 | 30 | 56 | 38 | 53 | 31 |
| Doncaster | 28 | 31 | 25 | 36 | 40 | 30 |
| Walsall | 29 | 40 | 35 | 41 | 38 | 17 |
| Bradford | 30 | 28 | 50 | 50 | 48 | 46 |
| Barrow-in-Furness | 31 | 20 | 27 | 33 | 52 | 47 |
| Pendle | 32 | 23 | 39 | 27 | 56 | 28 |
| Barnsley | 33 | 38 | 37 | 28 | 39 | 27 |
| Rotherham | 34 | 44 | 41 | 43 | 42 | 29 |
| Corby | 35 | 49 | 69 | 23 | 24 | 2 |
| Lincoln | 36 | 17 | 8 | 67 | 83 | 24 |
| Bolton | 37 | 45 | 63 | 39 | 63 | 43 |
| Sheffield | 38 | 39 | 26 | 52 | 57 | 38 |
| Bolsover | 39 | 41 | 47 | 26 | 25 | 36 |
| Ashfield | 40 | 37 | 34 | 51 | 49 | 52 |
| Derby | 41 | 42 | 38 | 56 | 58 | 50 |
| Preston | 42 | 35 | 29 | 66 | 77 | 26 |
| County Durham | 43 | 48 | 45 | 34 | 34 | 32 |
| Hyndburn | 44 | 33 | 57 | 45 | 69 | 39 |
| Copeland | 45 | 47 | 49 | 31 | 35 | 56 |
| Wigan | 46 | 55 | 78 | 55 | 70 | 58 |
| Great Yarmouth | 47 | 25 | 24 | 76 | 92 | 72 |
| Coventry | 48 | 46 | 33 | 57 | 67 | 51 |
| Wirral | 49 | 56 | 74 | 72 | 94 | 63 |
| Telford and Wrekin | 50 | 66 | 61 | 68 | 68 | 53 |
| Plymouth | 51 | 43 | 21 | 73 | 75 | 57 |
| Wakefield | 52 | 63 | 72 | 54 | 60 | 44 |
| North Tyneside | 53 | 65 | 79 | 62 | 72 | 34 |
| Norwich | 54 | 26 | 16 | 77 | 85 | 40 |
| Tameside | 55 | 58 | 82 | 44 | 78 | 45 |
| Chesterfield | 56 | 53 | 59 | 53 | 62 | 48 |
| Darlington | 57 | 60 | 64 | 71 | 101 | 37 |
| North Lincolnshire | 58 | 72 | 65 | 78 | 73 | 84 |
| Leeds | 59 | 52 | 43 | 91 | 91 | 59 |
| Kirklees | 60 | 64 | 77 | 74 | 86 | 61 |
| Bassetlaw | 61 | 67 | 68 | 69 | 64 | 83 |
| Peterborough | 62 | 68 | 85 | 58 | 80 | 54 |
| West Lancashire | 63 | 89 | 108 | 97 | 97 | 73 |
| Allerdale | 64 | 76 | 75 | 75 | 79 | 71 |
| Sefton | 65 | 79 | 103 | 104 | 110 | 91 |
| Newcastle-under-Lyme | 66 | 75 | 83 | 80 | 84 | 75 |
| Dudley | 67 | 77 | 80 | 89 | 93 | 65 |
| Calderdale | 68 | 74 | 98 | 81 | 98 | 67 |
| Northumberland | 69 | 86 | 92 | 82 | 87 | 70 |
| Carlisle | 70 | 70 | 67 | 86 | 103 | 66 |
| Blackpool | 71 | 51 | 52 | 87 | 123 | 93 |
| Ipswich | 72 | 62 | 58 | 102 | 111 | 64 |
| Wellingborough | 73 | 91 | 110 | 112 | 119 | 94 |
| Newark and Sherwood | 74 | 85 | 95 | 90 | 88 | 98 |
| Boston | 75 | 82 | 76 | 95 | 112 | 80 |
| Luton | 76 | 69 | 62 | 100 | 76 | 55 |
| Rossendale | 77 | 84 | 112 | 70 | 100 | 79 |
| North East Derbyshire | 78 | 111 | 123 | 94 | 90 | 89 |
| East Staffordshire | 79 | 92 | 100 | 98 | 113 | 86 |
| Bury | 80 | 101 | 131 | 92 | 118 | 85 |
| Nuneaton and Bedworth | 81 | 105 | 117 | 85 | 96 | 92 |
| Gloucester | 82 | 83 | 91 | 109 | 120 | 82 |
| Cannock Chase | 83 | 102 | 93 | 96 | 95 | 90 |
| Southampton | 84 | 54 | 18 | 103 | 99 | 68 |
| Hastings | 85 | 59 | 60 | 110 | 114 | 110 |
| Warrington | 86 | 115 | 130 | 105 | 130 | 88 |
| Portsmouth | 87 | 57 | 36 | 64 | 50 | 87 |
| Tamworth | 88 | 90 | 71 | 111 | 106 | 76 |
| Northampton | 89 | 104 | 97 | 107 | 127 | 60 |
| Waveney | 90 | 78 | 70 | 113 | 124 | 104 |
| Bristol | 91 | 71 | 30 | 108 | 104 | 78 |
| Newham | 92 | 50 | 66 | 1 | 1 | 115 |
| Erewash | 93 | 107 | 115 | 99 | 108 | 99 |
| Thanet | 94 | 73 | 73 | 121 | 132 | 102 |
| West Lindsey | 95 | 123 | 119 | 133 | 139 | 139 |
| Redditch | 96 | 94 | 96 | 114 | 122 | 42 |
| Havant | 97 | 99 | 127 | 122 | 117 | 69 |
| Amber Valley | 98 | 119 | 132 | 101 | 107 | 114 |
| Cheshire West and Chester | 99 | 124 | 138 | 132 | 141 | 109 |
| King's Lynn and West Norfolk | 100 | 140 | 134 | 134 | 140 | 132 |
| Swale | 101 | 96 | 86 | 139 | 135 | 108 |
| Fenland | 102 | 118 | 113 | 116 | 131 | 136 |
| Lancaster | 103 | 93 | 55 | 144 | 157 | 134 |
| Solihull | 104 | 146 | 192 | 130 | 129 | 100 |
| Barking and Dagenham | 105 | 88 | 163 | 8 | 11 | 81 |
| Milton Keynes | 106 | 135 | 164 | 135 | 121 | 95 |
| Chorley | 107 | 125 | 149 | 117 | 142 | 107 |
| Gosport | 108 | 108 | 126 | 129 | 133 | 105 |
| Basildon | 109 | 113 | 136 | 131 | 138 | 96 |
| Greenwich | 110 | 98 | 133 | 42 | 15 | 74 |
| Swindon | 111 | 143 | 167 | 136 | 136 | 96 |
| Worcester | 112 | 138 | 121 | 154 | 147 | 106 |
| Wyre Forest | 113 | 122 | 129 | 149 | 152 | 123 |
| Sedgemoor | 114 | 131 | 143 | 142 | 151 | 116 |
| Stockport | 115 | 142 | 179 | 127 | 160 | 124 |
| Gravesham | 116 | 106 | 114 | 151 | 115 | 138 |
| Scarborough | 117 | 114 | 106 | 155 | 172 | 126 |
| Dover | 118 | 110 | 118 | 146 | 143 | 120 |
| Kettering | 119 | 132 | 141 | 126 | 159 | 101 |
| Trafford | 120 | 152 | 170 | 143 | 146 | 117 |
| Exeter | 121 | 81 | 42 | 169 | 149 | 122 |
| Thurrock | 122 | 121 | 124 | 150 | 158 | 113 |
| Medway | 123 | 95 | 84 | 123 | 154 | 131 |
| Haringey | 124 | 80 | 90 | 5 | 5 | 151 |
| Breckland | 125 | 151 | 150 | 157 | 165 | 158 |
| North Warwickshire | 126 | 155 | 158 | 140 | 137 | 148 |
| Cheltenham | 127 | 134 | 104 | 184 | 166 | 111 |
| Wyre | 128 | 159 | 169 | 159 | 184 | 152 |
| Southend-on-Sea | 129 | 127 | 148 | 119 | 126 | 133 |
| Broxtowe | 130 | 144 | 137 | 137 | 144 | 130 |
| Gedling | 131 | 154 | 168 | 128 | 161 | 149 |
| Harlow | 132 | 109 | 105 | 125 | 173 | 140 |
| Lewisham | 133 | 97 | 116 | 6 | 7 | 128 |
| South Kesteven | 134 | 162 | 161 | 161 | 168 | 137 |
| Bedford | 135 | 133 | 147 | 177 | 150 | 118 |
| High Peak | 136 | 167 | 174 | 186 | 189 | 154 |
| Hackney | 137 | 61 | 53 | 2 | 2 | 77 |
| Tendring | 138 | 141 | 146 | 166 | 174 | 228 |
| East Lindsey | 139 | 164 | 102 | 162 | 163 | 180 |
| Cornwall | 140 | 148 | 109 | 176 | 182 | 168 |
| South Derbyshire | 141 | 178 | 173 | 145 | 153 | 187 |
| Stafford | 142 | 171 | 177 | 171 | 175 | 153 |
| Weymouth and Portland | 143 | 130 | 139 | 172 | 169 | 145 |
| Cheshire East | 144 | 179 | 208 | 174 | 192 | 146 |
| Brighton and Hove | 145 | 128 | 88 | 120 | 105 | 143 |
| Southwark | 146 | 87 | 89 | 3 | 3 | 62 |
| Eastbourne | 147 | 112 | 99 | 168 | 170 | 172 |
| Waltham Forest | 148 | 117 | 181 | 7 | 4 | 156 |
| East Riding of Yorkshire | 149 | 173 | 159 | 164 | 179 | 173 |
| Selby | 150 | 177 | 172 | 179 | 181 | 119 |
| North Devon | 151 | 158 | 151 | 183 | 193 | 186 |
| South Ribble | 152 | 176 | 187 | 167 | 191 | 184 |
| Ashford | 153 | 163 | 178 | 198 | 187 | 144 |
| Rugby | 154 | 175 | 183 | 170 | 185 | 127 |
| North West Leicestershire | 155 | 172 | 165 | 163 | 167 | 164 |
| York | 156 | 160 | 107 | 218 | 204 | 125 |
| Staffordshire Moorlands | 157 | 183 | 189 | 158 | 171 | 166 |
| Tewkesbury | 158 | 205 | 248 | 189 | 190 | 179 |
| Torbay | 159 | 116 | 111 | 191 | 202 | 196 |
| Slough | 160 | 149 | 142 | 156 | 82 | 141 |
| Canterbury | 161 | 137 | 81 | 232 | 197 | 197 |
| Shepway | 162 | 129 | 152 | 182 | 188 | 174 |
| East Northamptonshire | 162 | 181 | 166 | 152 | 178 | 169 |
| Charnwood | 164 | 136 | 87 | 200 | 205 | 155 |
| Taunton Deane | 165 | 156 | 160 | 190 | 196 | 159 |
| Torridge | 166 | 174 | 135 | 175 | 180 | 189 |
| Colchester | 167 | 150 | 153 | 202 | 195 | 162 |
| Bexley | 168 | 198 | 294 | 165 | 128 | 170 |
| Enfield | 169 | 157 | 203 | 83 | 28 | 178 |
| Forest of Dean | 170 | 182 | 156 | 185 | 183 | 167 |
| Isle of Wight | 171 | 153 | 128 | 192 | 200 | 215 |
| Oxford | 172 | 120 | 31 | 208 | 164 | 112 |
| Shropshire | 173 | 191 | 175 | 195 | 199 | 171 |
| Lambeth | 174 | 100 | 101 | 9 | 8 | 142 |
| Reading | 175 | 170 | 145 | 148 | 125 | 135 |
| Tower Hamlets | 176 | 103 | 122 | 4 | 6 | 103 |
| South Holland | 177 | 202 | 162 | 173 | 177 | 195 |
| Croydon | 178 | 165 | 237 | 65 | 22 | 225 |
| Lichfield | 179 | 197 | 193 | 203 | 207 | 147 |
| Brent | 180 | 147 | 157 | 61 | 9 | 150 |
| Crawley | 181 | 166 | 200 | 187 | 155 | 129 |
| Herefordshire | 182 | 189 | 171 | 213 | 219 | 165 |
| Mendip | 183 | 185 | 155 | 212 | 230 | 194 |
| Adur | 184 | 186 | 204 | 211 | 209 | 217 |
| North Somerset | 185 | 196 | 213 | 214 | 222 | 230 |
| Maidstone | 186 | 188 | 206 | 206 | 198 | 193 |
| Stevenage | 187 | 145 | 154 | 180 | 210 | 191 |
| Dartford | 188 | 168 | 182 | 188 | 162 | 235 |
| Hounslow | 189 | 200 | 274 | 115 | 33 | 161 |
| North Kesteven | 190 | 224 | 190 | 199 | 211 | 253 |
| Melton | 191 | 201 | 194 | 216 | 233 | 190 |
| Mid Devon | 192 | 184 | 180 | 196 | 203 | 176 |
| Bath and North East Somerset | 193 | 169 | 125 | 220 | 218 | 198 |
| Oadby and Wigston | 194 | 187 | 184 | 207 | 213 | 221 |
| Forest Heath | 195 | 195 | 202 | 178 | 186 | 163 |
| Malvern Hills | 196 | 229 | 233 | 248 | 235 | 201 |
| Islington | 197 | 126 | 120 | 19 | 10 | 160 |
| South Somerset | 198 | 204 | 195 | 209 | 216 | 208 |
| Hinckley and Bosworth | 199 | 211 | 205 | 204 | 212 | 202 |
| Braintree | 200 | 190 | 188 | 222 | 229 | 199 |
| Bournemouth | 201 | 139 | 94 | 205 | 201 | 121 |
| Havering | 202 | 230 | 308 | 153 | 145 | 200 |
| Ealing | 203 | 199 | 247 | 106 | 32 | 209 |
| St Edmundsbury | 204 | 192 | 199 | 201 | 217 | 157 |
| Stroud | 204 | 213 | 210 | 217 | 225 | 223 |
| South Staffordshire | 206 | 233 | 215 | 194 | 206 | 188 |
| Wiltshire | 207 | 218 | 235 | 225 | 228 | 210 |
| Rushmoor | 208 | 210 | 211 | 238 | 221 | 213 |
| Huntingdonshire | 209 | 232 | 242 | 215 | 233 | 211 |
| Babergh | 210 | 221 | 207 | 226 | 242 | 231 |
| Wandsworth | 211 | 194 | 230 | 79 | 59 | 203 |
| Richmondshire | 211 | 262 | 240 | 236 | 236 | 229 |
| Warwick | 213 | 217 | 185 | 260 | 231 | 207 |
| Daventry | 214 | 245 | 250 | 221 | 227 | 182 |
| Cambridge | 215 | 161 | 48 | 210 | 194 | 177 |
| Central Bedfordshire | 216 | 227 | 226 | 242 | 250 | 206 |
| Cherwell | 217 | 231 | 264 | 223 | 220 | 181 |
| Poole | 218 | 219 | 198 | 240 | 248 | 204 |
| Hillingdon | 219 | 242 | 297 | 193 | 89 | 226 |
| Basingstoke and Deane | 220 | 212 | 253 | 239 | 243 | 192 |
| South Gloucestershire | 220 | 216 | 222 | 228 | 251 | 266 |
| Rother | 222 | 214 | 229 | 241 | 245 | 264 |
| Redbridge | 223 | 206 | 255 | 118 | 36 | 289 |
| Aylesbury Vale | 224 | 226 | 259 | 257 | 238 | 214 |
| Sutton | 225 | 249 | 318 | 138 | 102 | 240 |
| Bromsgrove | 226 | 254 | 262 | 243 | 244 | 222 |
| Arun | 227 | 203 | 219 | 233 | 249 | 244 |
| Test Valley | 228 | 238 | 279 | 255 | 241 | 212 |
| North Norfolk | 229 | 220 | 186 | 224 | 232 | 269 |
| Worthing | 230 | 193 | 223 | 219 | 215 | 234 |
| North Hertfordshire | 231 | 223 | 243 | 237 | 240 | 227 |
| West Somerset | 232 | 214 | 176 | 227 | 226 | 219 |
| Craven | 233 | 257 | 272 | 229 | 263 | 237 |
| Wycombe | 234 | 246 | 261 | 244 | 208 | 216 |
| Teignbridge | 235 | 207 | 196 | 246 | 256 | 232 |
| Merton | 236 | 209 | 289 | 88 | 41 | 276 |
| Bromley | 237 | 260 | 319 | 160 | 148 | 254 |
| New Forest | 238 | 241 | 267 | 278 | 258 | 243 |
| Lewes | 239 | 222 | 216 | 250 | 260 | 270 |
| Suffolk Coastal | 240 | 235 | 221 | 231 | 247 | 284 |
| Chelmsford | 241 | 247 | 245 | 251 | 255 | 259 |
| Fylde | 241 | 255 | 276 | 235 | 254 | 287 |
| Fareham | 243 | 256 | 283 | 256 | 262 | 239 |
| Tunbridge Wells | 244 | 237 | 252 | 247 | 237 | 241 |
| Eastleigh | 245 | 243 | 258 | 249 | 245 | 257 |
| Wychavon | 246 | 253 | 249 | 234 | 252 | 205 |
| East Devon | 247 | 240 | 232 | 277 | 274 | 251 |
| Broxbourne | 248 | 250 | 217 | 245 | 224 | 261 |
| Woking | 248 | 276 | 293 | 269 | 223 | 249 |
| Camden | 250 | 180 | 140 | 59 | 47 | 248 |
| Welwyn Hatfield | 251 | 234 | 144 | 267 | 239 | 183 |
| Tonbridge and Malling | 252 | 225 | 224 | 273 | 261 | 233 |
| Maldon | 253 | 251 | 234 | 275 | 279 | 306 |
| Christchurch | 254 | 275 | 277 | 254 | 253 | 238 |
| Sevenoaks | 255 | 252 | 284 | 280 | 270 | 265 |
| West Dorset | 256 | 258 | 238 | 259 | 267 | 272 |
| Chichester | 257 | 236 | 251 | 281 | 269 | 224 |
| Derbyshire Dales | 258 | 289 | 266 | 264 | 276 | 260 |
| Hambleton | 259 | 267 | 269 | 291 | 291 | 218 |
| Rushcliffe | 260 | 276 | 257 | 252 | 259 | 252 |
| Surrey Heath | 261 | 295 | 315 | 318 | 278 | 296 |
| Mid Suffolk | 262 | 270 | 220 | 263 | 266 | 275 |
| Three Rivers | 263 | 290 | 298 | 284 | 273 | 256 |
| Hertsmere | 264 | 273 | 228 | 287 | 257 | 273 |
| Hammersmith and Fulham | 265 | 208 | 191 | 84 | 66 | 185 |
| Castle Point | 265 | 265 | 244 | 272 | 283 | 278 |
| Wealden | 267 | 279 | 282 | 298 | 295 | 300 |
| Cotswold | 268 | 278 | 280 | 262 | 268 | 245 |
| Dacorum | 269 | 263 | 275 | 268 | 264 | 274 |
| Barnet | 270 | 244 | 265 | 147 | 109 | 295 |
| Watford | 271 | 271 | 246 | 230 | 176 | 236 |
| Epping Forest | 272 | 283 | 271 | 283 | 279 | 282 |
| South Hams | 273 | 264 | 212 | 270 | 287 | 247 |
| Winchester | 274 | 261 | 227 | 292 | 292 | 246 |
| Harrow | 275 | 269 | 299 | 181 | 71 | 316 |
| Rochford | 276 | 294 | 296 | 315 | 302 | 297 |
| Chiltern | 277 | 298 | 314 | 308 | 288 | 281 |
| West Devon | 278 | 239 | 201 | 258 | 265 | 294 |
| South Lakeland | 279 | 284 | 260 | 282 | 298 | 242 |
| Blaby | 280 | 296 | 263 | 270 | 294 | 293 |
| West Berkshire | 281 | 285 | 288 | 306 | 282 | 271 |
| East Cambridgeshire | 282 | 268 | 218 | 279 | 293 | 317 |
| South Norfolk | 283 | 272 | 214 | 265 | 285 | 298 |
| Harrogate | 284 | 274 | 273 | 276 | 299 | 255 |
| Kensington and Chelsea | 285 | 248 | 197 | 124 | 116 | 268 |
| Eden | 286 | 288 | 241 | 266 | 281 | 258 |
| Guildford | 287 | 266 | 254 | 289 | 271 | 288 |
| Bracknell Forest | 288 | 259 | 270 | 274 | 272 | 250 |
| Ribble Valley | 289 | 287 | 292 | 261 | 307 | 314 |
| North Dorset | 290 | 280 | 225 | 293 | 297 | 263 |
| Wokingham | 291 | 314 | 317 | 303 | 290 | 299 |
| Harborough | 292 | 304 | 291 | 286 | 303 | 280 |
| Brentwood | 293 | 300 | 313 | 301 | 300 | 310 |
| East Hampshire | 294 | 286 | 286 | 294 | 296 | 285 |
| Reigate and Banstead | 295 | 298 | 305 | 288 | 289 | 291 |
| Ryedale | 296 | 292 | 239 | 290 | 314 | 262 |
| Waverley | 296 | 301 | 278 | 313 | 304 | 305 |
| Stratford-on-Avon | 298 | 305 | 281 | 299 | 305 | 286 |
| Westminster | 299 | 228 | 209 | 93 | 81 | 220 |
| South Oxfordshire | 300 | 312 | 309 | 302 | 301 | 277 |
| East Dorset | 301 | 311 | 304 | 309 | 317 | 311 |
| Mole Valley | 302 | 315 | 320 | 300 | 312 | 290 |
| Broadland | 303 | 282 | 236 | 285 | 306 | 313 |
| Rutland | 304 | 308 | 231 | 296 | 316 | 301 |
| Spelthorne | 305 | 303 | 306 | 295 | 275 | 282 |
| South Cambridgeshire | 306 | 317 | 303 | 322 | 309 | 302 |
| Horsham | 307 | 291 | 301 | 304 | 314 | 304 |
| Vale of White Horse | 308 | 297 | 295 | 310 | 313 | 292 |
| Mid Sussex | 309 | 309 | 307 | 307 | 310 | 309 |
| Epsom and Ewell | 310 | 316 | 311 | 319 | 277 | 308 |
| East Hertfordshire | 311 | 313 | 285 | 316 | 320 | 307 |
| Windsor and Maidenhead | 312 | 307 | 302 | 297 | 284 | 279 |
| City of London | 313 | 306 | 326 | 141 | 134 | 175 |
| St Albans | 314 | 319 | 316 | 311 | 286 | 321 |
| Purbeck | 315 | 293 | 256 | 317 | 318 | 267 |
| Kingston upon Thames | 316 | 281 | 287 | 197 | 156 | 320 |
| Elmbridge | 317 | 323 | 310 | 320 | 311 | 312 |
| Runnymede | 318 | 310 | 268 | 305 | 308 | 318 |
| West Oxfordshire | 319 | 302 | 290 | 312 | 319 | 315 |
| Richmond upon Thames | 320 | 318 | 325 | 253 | 214 | 319 |
| Uttlesford | 321 | 321 | 300 | 321 | 323 | 324 |
| South Bucks | 322 | 320 | 321 | 325 | 322 | 322 |
| South Northamptonshire | 322 | 322 | 312 | 314 | 321 | 303 |
| Hart | 322 | 324 | 323 | 323 | 324 | 323 |
| Tandridge | 322 | 325 | 322 | 324 | 325 | 324 |
| Isles of Scilly | 322 | 326 | 324 | 325 | 326 | 324 |
Download the data
• DATA: download the full spreadsheet
NEW! Buy our book
• Facts are Sacred: the power of data (on Kindle)
More open data
Data journalism and data visualisations from the Guardian
World government data
• Search the world's government data with our gateway
Development and aid data
• Search the world's global development data with our gateway
Can you do something with this data?
• Flickr Please post your visualisations and mash-ups on our Flickr group
• Contact us at data@guardian.co.uk
• Get the A-Z of data
• More at the Datastore directory
• Follow us on Twitter
• Like us on Facebook