Over the recent US holiday weekend, a blog post at a site primarily focused on investment raised the possibility that scientific progress might be hitting a wall. The author, who has a background in engineering and technology, illustrates his case with a series of four graphs that represent scientific discovery, all of which trend downwards, approaching zero. Based on these, things look pretty bad.
Oddly, the author himself provides one reason for these trends in his own article—and then rejects it. Along the way, the blog post provides some good lessons in understanding your sources. And, in the process, it inadvertently considers the nature of what we consider scientific discovery. Let's take a look at both of these issues.
Chart appeal
The blog post, by Paul Kedrosky, appears at a finance site called "Infectious Greed," and the post is provocatively titled "Science, Superstars & Stocks: Is Everything Getting Harder?" In it, the author uses four graphs showing a decline in productivity to suggest that doing science is getting harder, and he draws analogies to things like sports, where the big gains that came from modern nutrition and training seem to have slowed down, leaving records to fall in shrinking increments.
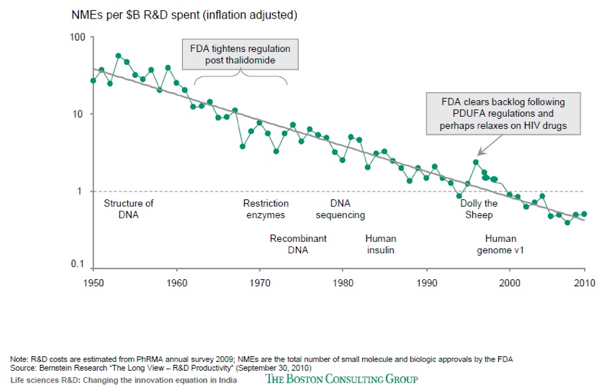
We'll leave the discussion of athletics and focus on science, where each of the four graphs show something—but not quite what the author thinks. The first tracks the pharmaceutical industry, showing a long-term decline in new drugs per (inflation adjusted) dollar spent. Part of that decline undoubtedly does reflect a challenging scientific environment, but it also reflects the fact that drug development is a business, and one that's governed by things like liability, patent law, and healthcare markets. Separating out the impact of science requires quite a bit more than the sentence that Kedrosky devotes to the graph; we'll just note that it doesn't necessarily support his argument.
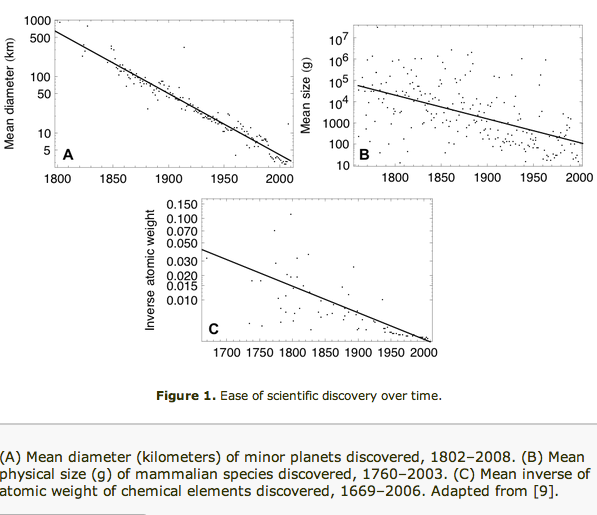
The remaining three charts are a bit more focused on actual research progress, and show declines in the rates of various discoveries; we'll discuss each separately below. Kedrosky doesn't name all his sources, even though he copied one legend verbatim, including a numbered reference to a paper. Fortunately, the text in the figure legend is sufficient to track it to a PLoS Computational Biology paper, which in turn borrowed it from a paper in an obscure journal called Scientometrics.
It's possible that, had Kedrosky taken the time to chase these graphs back to their source and then read and understand those articles, he wouldn't have used it to support his argument. Fortunately for us, understanding what the charts do show is pretty informative.
Was that easy or hard?
Kedrosky's argument is that we see "the same 'difficult discovery' problem taking hold over time in various disciplines." He suggests one potential reason for this—that we discover the easy things first, and are only left with the hard ones—but then dismisses this as "too pat."
Unfortunately, for some of these graphs, that explanation is exactly right. For all of them, it also depends on how you define things like "difficult" and "progress." To see why, we'll look at each of the graphs separately.
The first shows the size of the typical small body discovered in our solar system. Not surprisingly, it slopes downward. The biggest planets were discovered early and our instruments have gotten better, allowing us to spot ever-smaller bodies. But perhaps more importantly, many modern instruments are automated; the detection of bodies no longer requires a human to pore over photographic plates. As a result, discovery has actually gotten easier. The author of the original Scientometrics paper says that the cumulative number of minor bodies has experienced a long period of exponential growth. It's only by adopting size as a measure of progress that we can make things look bad.
The second graph shows that the typical size of the new mammalian species we're discovering is decreasing. Again, this is because big creatures are easier to spot. But what this measure—the mass of a new species in grams—misses is that, with modern molecular techniques, it has become far easier to say whether a new species is truly distinct or simply the close relative of something we've seen before. In fact, the DNA can often tell us a great deal about a species' evolutionary history.
So, spotting a species may be harder, but understanding something we spot is unquestionably easier, a fact that this simplistic measure of progress (body mass) misses entirely.
New chemical elements have been discovered at a rate of about four per decade, initially as a result of careful chemical isolation of naturally occurring elements, and later through the fusion of smaller nuclei to create artificial elements. Here, to show a decline, the graph has to plot the inverse of the element's atomic weight vs. time; plotting its actual mass would show an upward slope.
Oddly, although this is the most artificial of the graphs, things really have been getting harder here. Basic physics dictates that, as the atomic mass increases, it gets more challenging to smash the right combination of atoms together to create an element, and anything that results is less stable. Again, we did the easy stuff first and we continue to make progress—provided you plot the actual atomic mass of our discoveries.
The examples here don't obviously support any argument. Some things are getting harder, some easier, and, in all cases, these measures are extremely sensitive to how someone defines progress. But these particular measures have features that make doing the easy things first inevitable... and they ensure that "progress" will eventually drag to a halt.
Finite sets and the limits of scientific progress
The key feature of these subjects is that they are measures of progress within what we could call a finite set. There are only so many bodies of appreciable size in the solar system or so many mammals on Earth, for instance.
Inevitably, when faced with a finite set, we'll spot the easiest examples first. As Kedrosky notes, it probably wasn't easy at the time, as the naturalists who risked disease and extended ocean voyages to visit places like Borneo would attest. Elements may not technically be a finite set—you could easily describe something with ludicrous numbers of protons and neutrons—but physics puts real limits on what we can accomplish. Nuclei above a certain mass don't combine readily; the products of these fusions last for ludicrously small fractions of a second; at some energies, atoms simply dissolve into a soup of quarks and gluons; et cetera.
With a finite set, as long as there is some appreciable rate of discovery, we'll eventually run out of examples and progress will not just slow, but halt entirely. As the author of the Scientometrics paper notes, we've not discovered a new human organ since the 1880s, when the parathyroid gland was first reported. But that halt doesn't mean an end to scientific discovery; we've clearly learned a lot about the human body since 1880. It just means that that particular measure of progress (number of organs discovered) is no longer informative.
Just as problematic is the fact that, for many measures of progress, the ultimate output is effectively infinite. We've not found a new particle in years, but the LHC is already producing more collisions than we can possibly store, forcing us to discard the data on many collisions. Even if none of these collisions reveal a new particle, in their "failure" they will gradually eliminate dozens of theoretical ideas about the nature of our universe with ever-greater certainty. By that measure of progress, things are rosy.
And particle physics is a relative slacker compared to genomics. Every individual on the planet contains a genome that's essentially unique, but also has many cells that inevitably picked up additional mutations over their lifetimes. And that's just humans—we're also making staggering progress on picking through the DNA of bacteria and viruses. And here, because so much is terra incognita, the rate of discovery remains very, very high.
In both these cases, faced with sources of data that are effectively infinite, we're making progress at a pace that would be considered mind-blowing just a few decades ago. Recognizing that, however, involves a different measure of "progress."
None of this was necessary
Kedrosky's speculation on the difficulty of discovery takes an extremely narrow view of what constitutes "progress," and it never bothers to define what's "difficult." It's hard to begrudge him this speculation, given that it ends in a paean to human creativity in the sciences and elsewhere. But by eliding almost all of the details, his conclusion—"things are getting harder, and they will continue to do so"—doesn't provide much in the way of perspective or understanding. Kedrosky dismisses a real factor in the rate of discovery as "too pat" and doesn't fully recognize the limits of his own supporting evidence; he writes with confidence about something he doesn't seem to fully understand.
It didn't have to be that way. Simply by tracking back to the source of his graphs, he could have gotten a much better understanding of what he was looking at.
The immediate source, the PLoS paper, doesn't even consider the pace of scientific progress; instead, it's focused on whether we can identify quantitative measures of such progress. That paper's authors accept that the graphs represent an interesting approach to providing these measures, but they don't even bother to comment on whether the graphs show that progress has become any more difficult.
The author of the original Scientometrics article, Harvard's Samuel Arbesman, however, is up front about the limits of his study. He notes that he's looking at "areas where discovery—not simply scientific output—is well-defined and may be easily quantified." It's an interesting way to look at science, but it can't be expected to capture science as a whole.
Moreover, Arbesman explicitly states that it's not simply a matter of difficulty that dictates discovery, writing that his results suggest "scientific discovery can be best understood as the outcome of both scientific output and ease of discovery." So, even if it's getting harder to spot bodies in our solar system (something that's debatable, as noted above), we can easily compensate by raising our output, which we've done.
It's precisely because he realizes that his graphs don't completely capture scientific progress that Arbesman warns his readers, "Despite all this talk of ease and difficulty, though, we should not, as a society or as scientists, find ourselves lapsing into the despondent state of affairs found at the end of the Nineteenth Century that all science was nearly complete."
In his blog post, Kedrosky doesn't lapse into despondency. But he does fail to recognize how his supporting evidence has been chosen very selectively, how the way we set up definitions and metrics can affect the results we see, and how in some cases the graphs actually show discoveries becoming easier.
Listing image by Photo by Evan Wohrman
reader comments
33