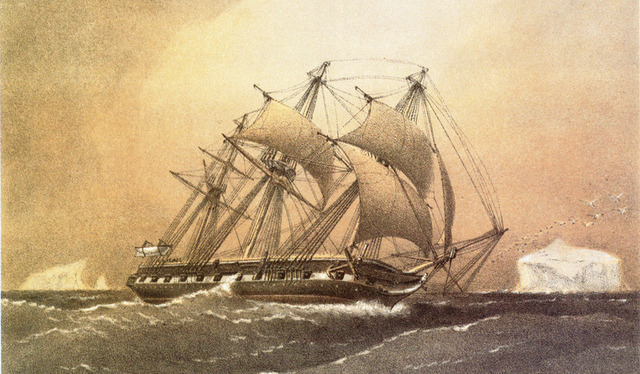
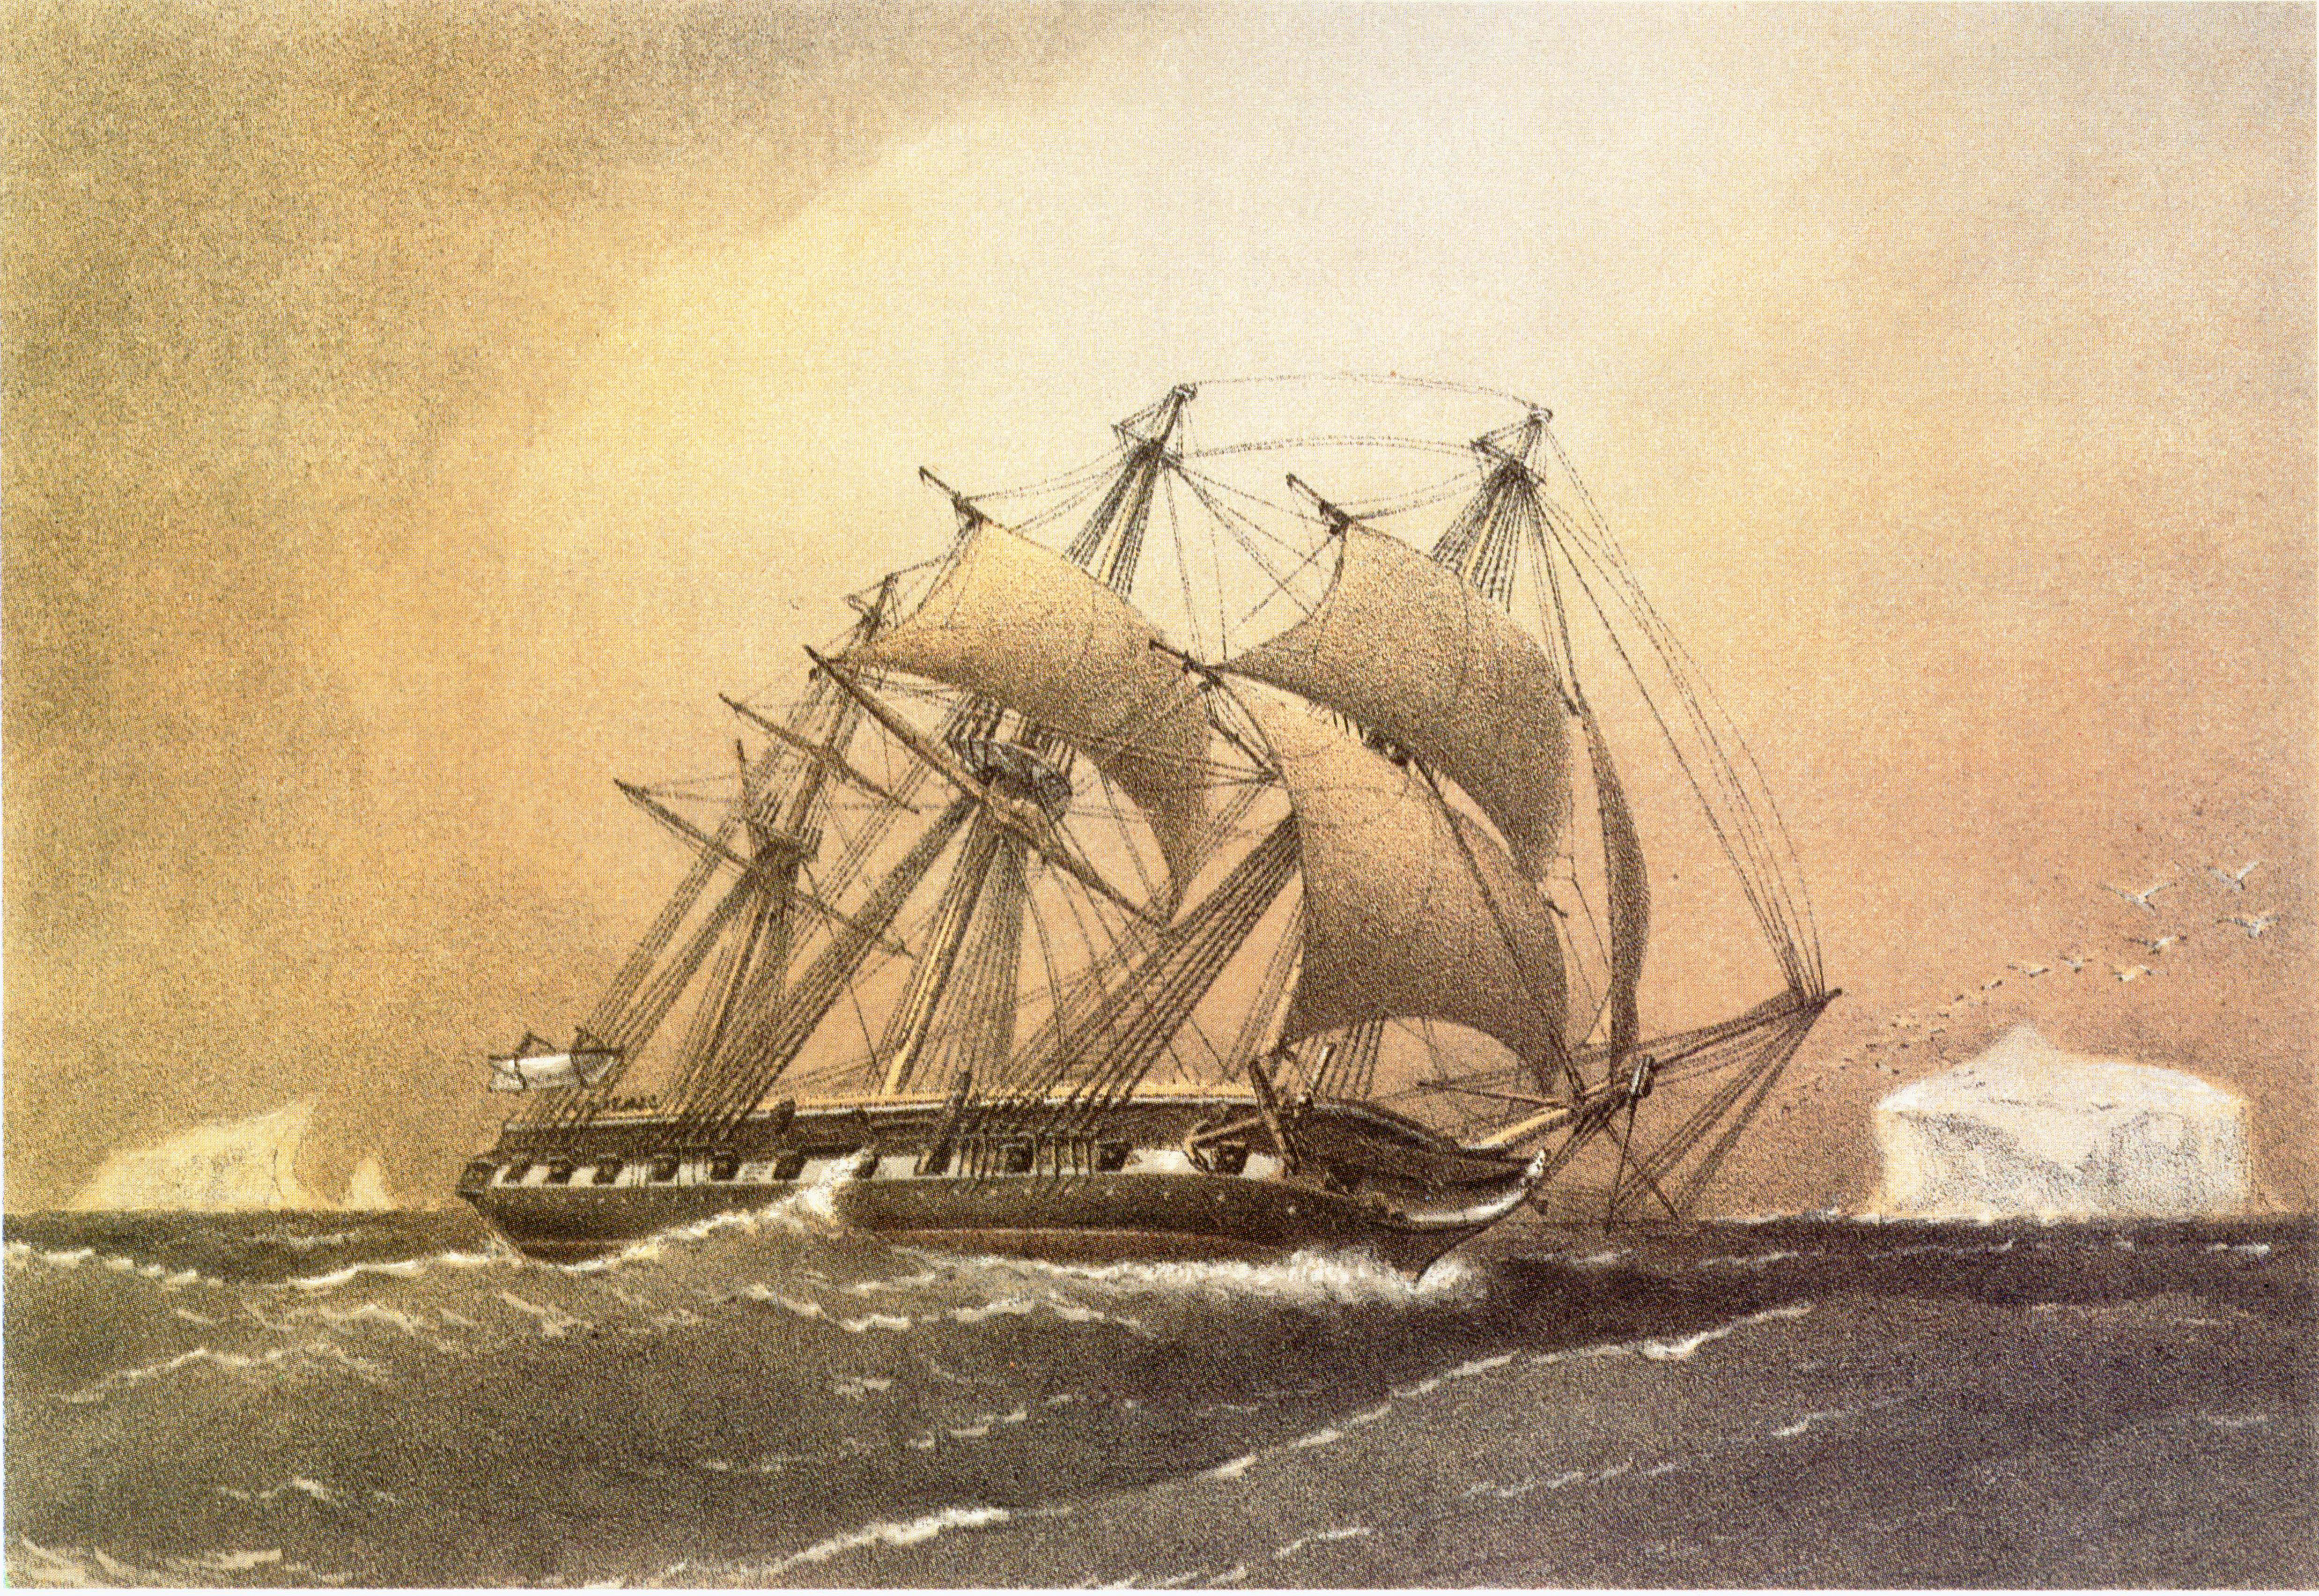
In 1872, the HMS Challenger left Portsmouth on a daring mission, but it didn’t set sail as a military ship. It had been retrofitted, not to project power, but to humbly petition the ocean to give up some of its secrets. Over three and a half years, the Challenger and its crew of over 200 (at the start, that is) circumnavigated the globe, collecting every scrap of information they found along the way. The crew frequently measured the depth of the seafloor and the temperature profile of the water, and brought up sediment samples (sometimes including living organisms). Among other accomplishments, the expedition discovered the submarine mountains of the Mid-Atlantic Ridge, described more than 4,700 new species, and learned that the ocean was stratified by temperature.
There is still much we do not know about the ocean, but quite a lot has changed. Thanks to the Argo project, we’re now up to 3,500 automated buoys that continuously record data from the upper 2 kilometers of Earth’s oceans. Using that incredible data coverage, oceanographers were able to compare Challenger’s temperature measurements to today’s oceans.
For each of 273 Challenger temperature profiles from the Atlantic and Pacific Oceans, researchers interpolated Argo measurements from the same location, depth, and time of year. Modern surface ocean temperatures (averaged over 2004-2010) were higher at 211 of those points. On average, the surface of the Atlantic is about 1°C warmer—0.4°C for the Pacific. The authors write, “As the Challenger's sampling was more intensive in the Atlantic and the warming may be greater in that ocean, we estimate the global difference as the area-weighted mean of the Atlantic and Pacific values, 0.59° C ±0.12.”
As you’d expect, that difference diminishes with depth. At 366 meters (200 fathoms), the area-weighted “global” average today is 0.39° C ±0.18. At 914 meters (500 fathoms), it’s down to 0.12° C ±0.07, and the difference disappears by about 1,500 meters depth.
These numbers may underestimate the warming for a number of reasons relating to the Challenger measurements. For example, the crew worked under the assumption that the line holding the thermometer extended downward perfectly perpendicular to the surface. In reality (as they knew), it was likely to trail behind the motion of the ship, which couldn’t be kept completely stationary. That means the thermometer would measure at a depth a bit shallower than intended, yielding a warmer temperature.
El Niño Southern Oscillation (ENSO) variability shouldn't have much impact on the analysis. Challenger's route cut quickly across the equatorial Pacific and avoided the eastern equatorial Pacific altogether, so most of the sampling was done outside the areas affected most. Also, averaging the Argo data over 2004-2010 makes for a minimal El Niño/La Niña bias.
The calculated differences are consistent with warming estimates from other reconstructions and records. Still, the additional data points provide some useful perspective. The researchers note that the sub-surface measurements are useful in calculating the past contribution of thermal expansion to sea level rise.
They conclude, “The Challenger data set was a landmark achievement in many respects. With regard to climate and climate change, Challenger not only described the basic temperature stratification of the oceans, but provided a valuable baseline of nineteenth-century ocean temperature that, along with the modern Argo data set, establishes a lower bound on centennial-scale global ocean warming.”
Nature Climate Change, 2012. DOI: 10.1038/NCLIMATE1461 (About DOIs).
Listing image by Image courtesy of Wikimedia Commons
reader comments
60