If you look at a graph of global temperature over the last century, something probably jumps out at you: a dip around the 1960s. There have been several thoughts about this period of cooler temperatures. Some have pointed to fluctuating human aerosol (fine particle) emissions, which reflect sunlight and can cool the planet, as an important factor. Others have suggested that longer-term variation in Atlantic Ocean circulation—termed the Atlantic Multidecadal Oscillation, or AMO—was the driver. To complicate matters, aerosols may have influenced the AMO, or the two may have had a combined impact.
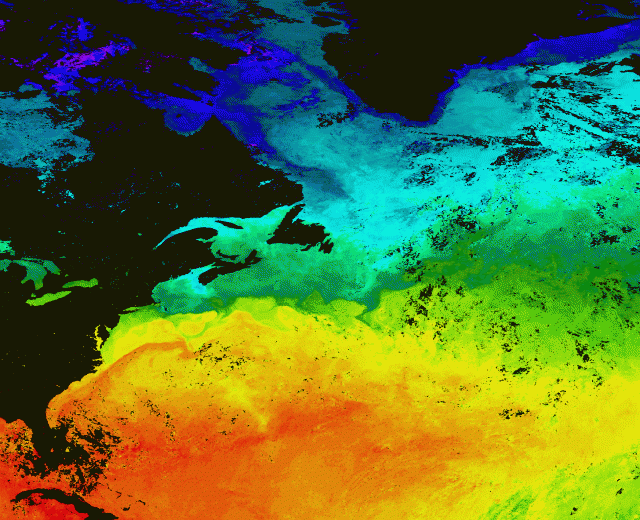
Surface water that flows into the North Atlantic cools as it nears the Arctic, sinks into the deeps, and flows back to the south, driving the conveyor belt of circulation in the Atlantic. It’s thought that the AMO involves a strengthening or weakening of that sinking over the span of a decade or more—causing the conveyor belt to slow down or speed up. Because the distribution of cold and warm water at the surface changes, the AMO can affect both regional and global climate (as does the El Niño Southern Oscillation, which tends to cycle on shorter time scales).
The Atlantic Multidecadal Oscillation has been a hot topic of research in recent years, but lots of questions remain. Because it’s so slow, there are only a couple oscillations in the instrumental temperature record. That’s not much to work with in terms of understanding what drives the AMO and how it impacts global climate. It has been studied in temperature proxy records of the last millennium, and even in ice cores, but its behavior appears to change with time. In some records, it looks like it oscillates over about 60 years, but in others it seems to only take 20 years. Similar behavior arises in some climate models, as well, but the specifics differ from model to model.
A new paper takes an interesting route to study the AMO further into the past by using the longest-running temperature record on the planet. Measurements have been taken in central England since 1659—shortly after sealed liquid thermometers were invented. Of course, it’s a local record and not the global average. But after comparing it to global temperatures going back to 1850, researchers Ka-Kit Tung and Jiansong Zhou of the University of Washington believed global patterns were reflected in the central England record well enough to justify the analysis.
They identified a dominant AMO-like oscillation 50 to 80 years in length throughout the record. Based on their analysis, they think the AMO had a role in all the largest climate shifts of the last 400 years. The Little Ice Age, a cool period in the 16th to 19th centuries, was likely caused by a lull in solar output and a string of large volcanic eruptions, but the researchers believe a downward swing of the AMO prolonged the cooling, and the subsequent upward swing helped bring it to an end.
They attribute a large portion of the warming in the first half of the 20th century to the AMO, with a secondary role for anthropogenic greenhouse gases and a small boost from solar activity. They also attribute the cooling around the 1960s and some of the warming in the 1990s to the AMO. In fact, after removing their calculated AMO contribution from the 20th century, they concluded that human-caused warming has been relatively linear since about 1910, at about 0.08°C per decade. That’s about half the rate estimated by others who have tried to account for sources of natural variability over the last 30 years (the span for which satellite data is available).
Tom Delworth, a researcher at NOAA’s Geophysical Fluid Dynamics Laboratory who has studied the AMO, told Ars that those calculations are a bit of a stretch. “I have serious reservations about the central conclusions of the paper,” Delworth said. “I think it tries to draw conclusions which are really beyond the scope of the evidence available.”
Delworth’s primary concern is the use of the central England temperature record as a global indicator. Because the AMO affects the distribution of temperatures, warming in the North Atlantic can be offset by a corresponding cooling in the South Atlantic. Teasing apart the precise extent to which the AMO influenced global temperature is a difficult task, and Delworth noted that the study’s “conclusions are very different than most of the work in the field.”
Another researcher told Ars that while the study is interesting, the AMO is still too poorly understood. Further research using climate models could help scientists work out the processes underlying the AMO that might cause its behavior to vary (which could include human alterations of climate). That could help us understand its role in the 20th century.
Proceedings of the National Academy of Sciences, 2013. DOI: 10.1073/pnas.1212471110 (About DOIs).
reader comments
51